Test grades
How Many Questions Can You Miss and Still Pass?
How many questions you can miss and still pass: the formula, a 25-question breakdown, and a table for 10- to 100-question tests at 60%, 70%, 75%, 80% and 90%.
Clear, practical guides for understanding test grades, raw scores, weighted categories, extra credit, rounding rules, and percentage-to-letter-grade conversions.
Each guide answers one grading question directly, shows the formula or policy behind it, and links to the right calculator for the next step.
How many questions you can miss and still pass: the formula, a 25-question breakdown, and a table for 10- to 100-question tests at 60%, 70%, 75%, 80% and 90%.
What weighted grades mean, how weighted and unweighted grades differ, how to calculate a weighted grade (even with empty categories), and how course weights differ from weighted GPA.
Learn how bonus points and extra-credit assignments change a test or course grade, with formulas, examples, and common gradebook methods.
Understand common grade rounding methods, decimal precision, boundary scores, and why an 89.5% does not automatically become a 90% in every course.
Learn the GPA formula step by step, see the difference between weighted and unweighted GPA, and work through a full example with credit hours.
Understand the difference between the 4.0 unweighted GPA scale and the 5.0 weighted GPA scale used for AP, Honors, and IB courses in high school.
Learn the formula for finding the score you need on a final exam to reach a target course grade, with a worked example and common edge cases.
Learn how to combine GPA and credit hours from multiple semesters into one cumulative GPA, with a worked multi-term example.
A complete letter grade to GPA conversion table on the standard 4.0 scale, including plus/minus grades and common percentage equivalents.
Learn the most common passing-grade thresholds for K-12 and college courses, why they differ by school, and how pass/fail grading changes the rules.
Learn the most common ways instructors curve grades, including flat-point curves, percentage curves, and scale shifts, with worked examples of each.
Practical tips for teachers using a grade calculator and grade chart to grade quizzes, tests, and assignments faster and more consistently.
A practical, calculator-based approach to diagnosing a slipping grade mid-semester and figuring out what it will actually take to recover it.
Understand exactly how AP, Honors, and IB courses add bonus GPA points, why the bonus varies by school, and how it affects class rank.
Learn the formula for turning correct answers or points earned into a percentage grade, plus how to combine weighted categories and solve for a final exam score.
Learn what an Easy Grader (EZ Grader) is, the formula behind it, where the printed grading chart came from, and how to use one to grade tests fast.
Learn the quick grader method teachers use to turn test scores into percentages and letter grades in seconds, with formulas, examples, and shortcuts.
See the standard A–F grading scale with percentage and GPA breakdowns, why there's no E grade, how plus/minus grades work, and how scales vary by school.
Check a test grade in seconds with this free grade checker guide: the formula, step-by-step instructions, common mistakes, and a standard scale reference.
Learn how a gradebook calculator combines weighted categories into one course grade, with a worked example, mid-semester tracking tips, and common mistakes to avoid.
A step-by-step walkthrough for calculating your grade: identify your grading system, gather your scores, run the math, and avoid the mistakes that throw off the number.
Learn how credit hours weight your GPA calculation, with a worked example, why high-credit classes move your average more, and what pass/fail and transfer credits do to the number.
Compare rubric grading and point-based grading for real classroom speed — what each costs upfront, which is faster per paper, and tips to speed up either method.
Learn the difference between a semester grade and a final course grade, how each is calculated, and the common mix-ups — like dropped scores and mismatched weights — that throw off the number.
Divide the score by the total and multiply by 100, then match your grading scale. Score-to-grade conversion chart for tests out of 10, 20, 25, 50, and 100.
89% is a B on the plain scale, a B+ with plus/minus, and one point short of an A−. Full percentage-to-letter table plus a ruling on every borderline percentage.
A 7-point scale needs a higher score for every letter — an 82% is a B on a 10-point scale but a C on a 7-point. Side-by-side conversion chart and the GPA effect.
Add the points, divide by levels times criteria, multiply by 100 — then rescale so the lowest level is 60%, not 0%. Conversion table, the formula, and the Marzano method.
One assignment is worth its weight — its points divided by the course total, or its category weight divided by the number of assignments. Tables plus the math for how far one score moves your grade.
Free printable grading scale for teachers: plus/minus and 10-point charts, minimum correct answers for 10–50 question tests, and how to print and laminate your own.
Grade percentage chart for every whole percent from 100 to 60, with the letter on the 10-point, 7-point and plus/minus scales and its 4.0 GPA value.
An A- is 90–92% and worth 3.7 GPA. Every plus and minus grade percentage from A+ to D-, how the bands are built, and how they change your GPA.
Real extra credit can't lower your grade, but your grade can drop after it. Four gradebook reasons, with the math, and how teachers set extra credit up correctly.
Divide correct answers by total questions and multiply by 100. Worked examples, plus mixed point values, partial credit, guessing penalties and percentiles.
15 out of 20 is exactly 75.00%, a solid C grade on the standard US scale. See the full 20-question grade chart, GPA conversions, scale variations, and syllabus weighting math.
17 out of 20 is exactly 85.00%, a solid B grade on the standard US scale. See what you need for an A, why B+ is mathematically unreachable, and GPA impact.
14 out of 20 is exactly 70.00%, a C− or C grade on the standard US scale. See if 14/20 is passing, college prerequisite rules, GPA values, and recovery tips.
11 out of 15 is 73.33%, a solid C on the standard US scale. See the full 15-question score chart, why each question swings 6.67%, and turnaround math.
10 out of 15 is 66.67%, a D grade on the standard US scale. Discover passing boundaries, college prerequisite risks, 1.0 GPA value, and recovery math.
26 out of 30 is 86.67%, a high B grade on the standard US scale. See the complete 30-question score chart, B+ rounding cutoffs, and pacing to achieve an A.
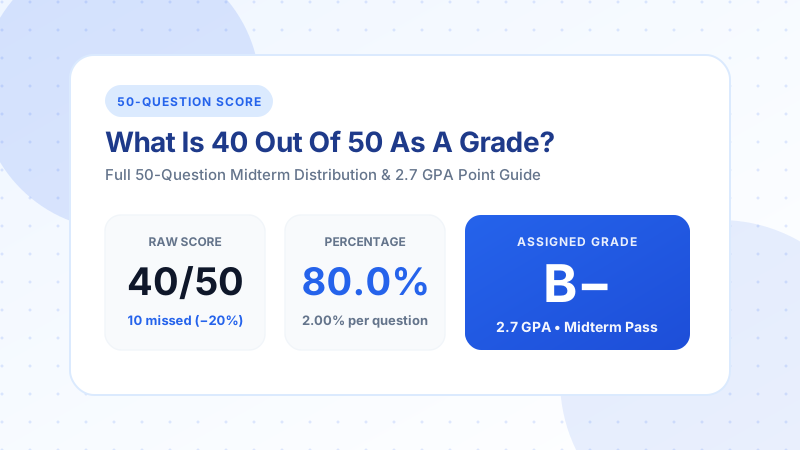
40 out of 50 is exactly 80.00%, a B− on the standard US scale. See the full 50-question midterm conversion chart, GPA values, and syllabus recovery math.
On a 20-question test you can miss 8 questions and still pass at 60%, but only 1 for an A. See the exact missed-question limit for every letter grade.
On a 25-question test you can miss 10 questions and still pass at 60%, 7 for a C and 5 for a B. See the exact missed-question limit for every letter grade.